Reading your municipal water quality report
A consumer confidence report lists detected contaminants, ranges, and limits. See which columns matter, what the units mean, and what to test privately.
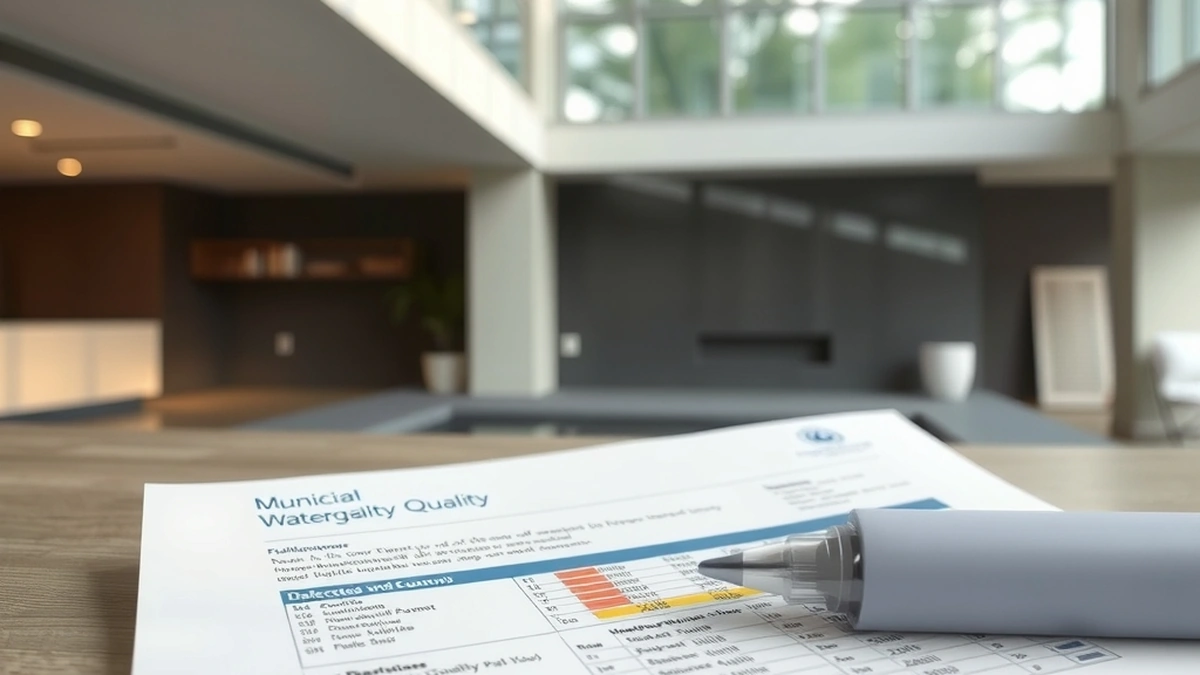
A municipal water quality report lists each detected contaminant with its detected range, the regulatory limit, and the likely source. Read the detected values against the limits first, then look for hardness, chlorine type, and any violation notices at the top of the report.
- Report frequency
- Annually by July 1
- Key column
- Detected level versus MCL
- Nitrate limit
- 10 mg/L
- Hardness units
- mg/L or grains per gallon
- Private test cost
- $40 - $150
Some links on this page are affiliate links.If you buy through them we may earn a commission at no extra cost to you. We do not accept payment for rankings. Read the full disclosure.
A municipal water quality report is a table of detected contaminants with four things you need: the detected level, the regulatory limit, the range across the year, and the likely source. Read the detected level against the limit first. Everything else is context.
What the Report Is
The consumer confidence report, sometimes called a CCR or annual water quality report, is required of community water systems and typically arrives by July 1 each year. It covers the previous calendar year.
It is a compliance document, not a marketing brochure. That means it lists what was detected and what was not, and it must disclose violations. It is also written to satisfy a regulation, which is why the columns are not always intuitive.
| Column | Meaning |
|---|---|
| Contaminant | The substance measured |
| MCL or limit | Maximum allowed concentration |
| MCLG | Health goal, non-enforceable |
| Detected level | What was actually measured |
| Range | Lowest to highest across the year |
| Violation | Whether the limit was exceeded |
| Source | Where the contaminant typically comes from |
The Columns That Matter
Detected level versus MCL. If the detected level is below the limit, the system is in compliance. That does not mean the level is zero, and it does not mean the water is ideal for every use. It means the utility met the standard.
Range. A report showing a detected level of 4 ppb with a range of “nd to 12” tells you the annual average hides a peak. The peak matters if you are sensitive or if you are sizing treatment.
Unit. Contaminants are reported in mg/L, µg/L, ppm, ppb, or pCi/L. Mixing them up produces nonsense comparisons. 1 mg/L equals 1 ppm; 1 µg/L equals 1 ppb.
Violation notice. If there is one, it is at the top in plain language. Read it before anything else.
Units and Conversions
| Unit | Equivalent | Used for |
|---|---|---|
| mg/L | 1 ppm | Nitrate, sodium, hardness |
| µg/L | 1 ppb | Lead, arsenic, PFAS |
| pCi/L | picocuries per liter | Radon, uranium |
| GPG | 17.1 mg/L as CaCO3 | Hardness for softener sizing |
Hardness is the conversion that matters most for equipment. A report listing 180 mg/L as calcium carbonate is 180 ÷ 17.1 = 10.5 GPG, which is the very hard band. A softener sized for “moderate” water would be undersized.
Nitrate has a federal limit of 10 mg/L. A report showing 8 mg/L is in compliance and close enough to the limit that a private test at the tap is worth doing, especially with an infant in the house.
What the Report Does Not Tell You
The report covers the utility’s distribution system, not your plumbing. Three gaps matter:
Your service line. Lead can enter between the main and the tap. A utility report showing low lead does not rule out a lead service line. Test at the tap if the house was built before the late 1980s.
Your building’s pipes. Older interior plumbing can contribute copper or lead. The report cannot see this.
Hardness for equipment sizing. Some reports include it, many do not. Without it, softener sizing is guesswork.
That is why a private test at $40 to $150 is still worth doing even with a clean municipal report. The report tells you what left the plant; the test tells you what arrives at your kitchen.
There is also a timing gap. The report covers a calendar year that ended months before you read it, and utilities sometimes change source water or treatment between reports. If your water suddenly tastes different in March, the report published in July will describe last year, not this week. A current test is the only way to see the change.
Five Steps to Read It Properly
- Find the violation section and read it first.
- Scan the detected level column against the MCL column for anything close to the limit.
- Convert hardness from mg/L to GPG if it is listed.
- Note the disinfectant used, chlorine or chloramine, because it decides what carbon you need.
- Compare the source notes for anything that matches a symptom you have, such as corrosion or sediment.
From Report to Equipment
A clean report with hardness at 12 GPG and chlorine residual points at a softener and a carbon filter, not a reverse osmosis system at every tap. A report with nitrate near the limit points at RO at the kitchen sink. A report with a lead action level exceedance points at point-of-use treatment and a service line inspection.
| Report finding | Practical response |
|---|---|
| Hardness above 7 GPG | Softener |
| Chlorine or chloramine | Carbon filter |
| Nitrate near 10 mg/L | Under-sink RO |
| Lead detected | Tap test, then point-of-use |
| Arsenic detected | RO or specialty media |
| No hardness listed | Private hardness test |
Where the Report Fits
Use the report to rule things out, then use a private test to confirm what is left. That sequence avoids buying treatment for a contaminant that is not present and avoids missing one the utility does not monitor at your tap.
For well owners there is no CCR at all, so the lab panel is the only source. Well water testing covers what to order, and how to read a water test report covers the lab format rather than the utility one. If the report shows hardness in the very hard band, start with water softener sizing.
One habit that pays off: keep the last three reports in a folder with your appliance manuals. Trends show up across years that are invisible in a single report, such as nitrate creeping upward or hardness shifting after a source change. Those trends are exactly what a treatment decision should be based on.
Frequently asked questions
What is a consumer confidence report?
An annual document that community water systems must provide, listing detected contaminants, their levels, the applicable limits, and any violations during the year.
What does MCL mean on a water report?
Maximum Contaminant Level, the highest concentration of a contaminant allowed in delivered water under federal drinking water rules.
How do I convert mg/L to grains per gallon for hardness?
Divide the mg/L figure by 17.1; water at 171 mg/L as calcium carbonate is 10 grains per gallon, which is in the hard band.
Does the report tell me if my water is hard?
Many reports list hardness or calcium and magnesium, but some do not, so a private hardness test may still be needed before choosing a softener.
Why are some contaminants listed as not detected?
Systems report only what they monitored; a contaminant below the detection limit is listed as nd or not detected rather than as a measured value.
What should I do if the report shows a violation?
Read the notice section, follow any guidance the utility issued, and consider testing at the tap, since a violation may mean the delivered water exceeded a limit.
Sources
Some links are affiliate links.If you buy through them we may earn a commission at no extra cost to you. We do not accept payment for rankings. Read the full disclosure.